CT Simulation
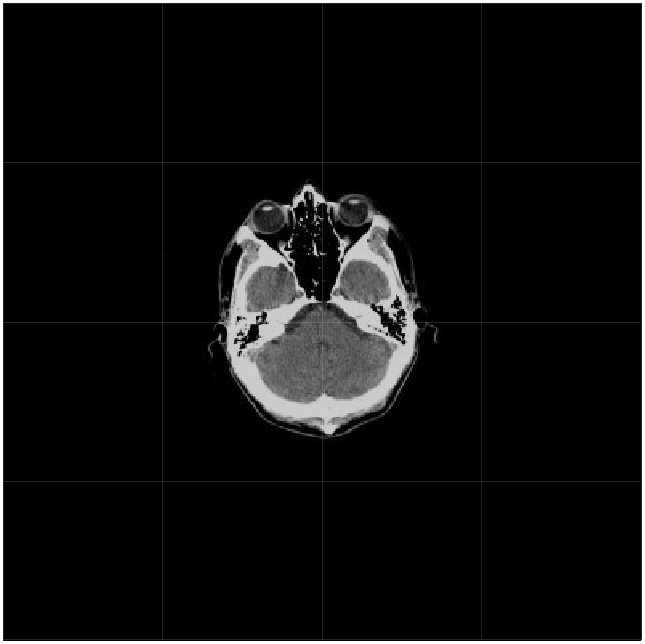
Initial Object to Scan
The goal of this project is to demonstrate how a CT Images are created. This is done in 3 subprojects: CT Simulation, The Algebraic Reconstruction Technique, and Metal Artifact Reduction. This project begins with the simulation. Since the machines are expensive, it is easier to being with a CT image and transform it into CT Data, called a sinogram, with software.
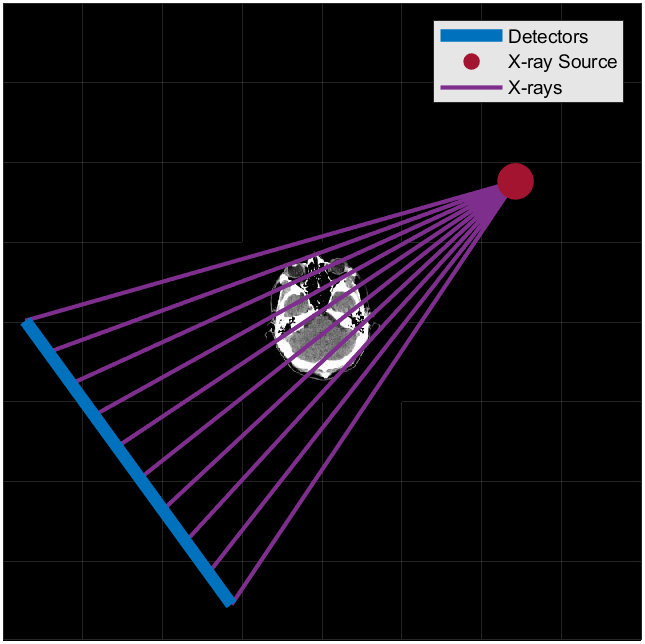
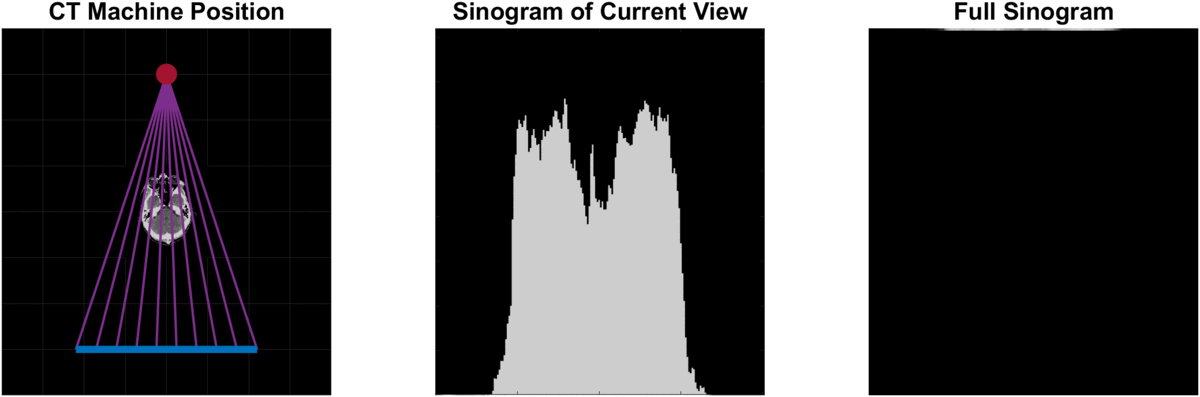
CT Machine Configuration
As is the case with any simulation, a physical approximation of the machine is needed. This image shows the manin components of a CT machine, the x-ray source, the detectors, and the locations of the beams themselves. In this simulation there are many more beams than pictured, but the overall visual effectively shows what the machine looks like in this simulation.
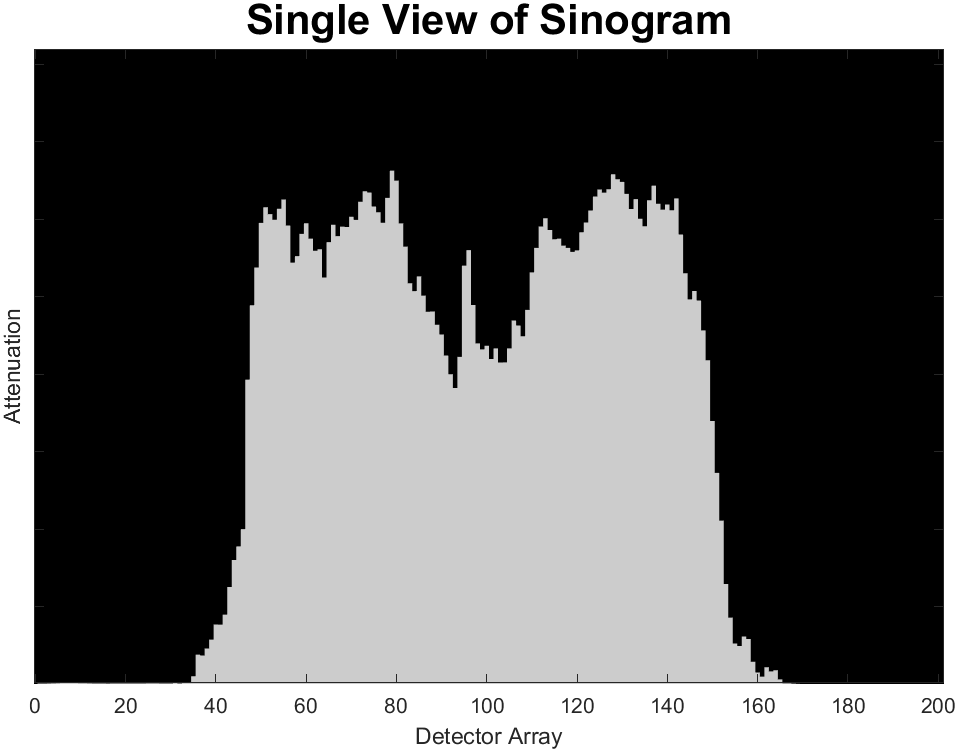
Sinogram - Single View
For any given position of the machine, this is a visualization of the values that the detector read. The higher the value, the more bone or harder material was present.
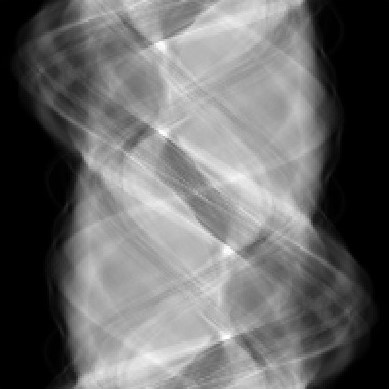
Full Sinogram
The individual views can be stacked on top of each other to create a sinogram. Points in real space are represented as sinusoidal waves. Sinograms are simply a collection of sine waves.
Full Simulation
This is a full visualization of the process of collecting CT data. The .gif speaks for itself and shows the process of the simulation. THe virtual machine is rotated around the image and simulated detector data is collected.
Algebraic Reconstruction Technique
ART Reconstruction
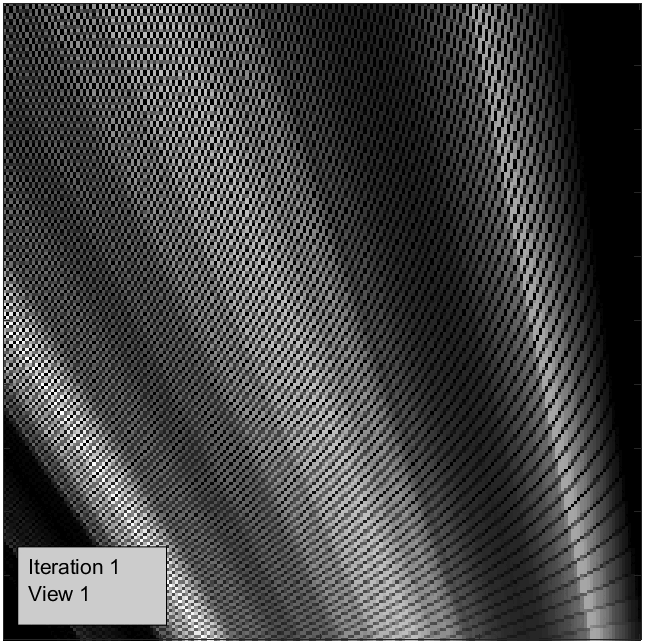
Reconstruction is the most technically challenging aspect of this project. A full description can be found in the README.md here. The reconstruction is handled through 2 loops. The first loop iterates through every view in the CT data. THe second loop creates iterations of these complete view calculation. Another note to be made is that this is a different dataset as the one referred to at the beginning of this page. This is a chest CT. Lastly, there are many processing techniques and entirely other reconstruction methods that are possible. Namely, Fourier Transform is the industry standard. This is where Sinogram Data is transformed into Fourier Data and then computed into image data. I may explore this in another project, but not for the time being.
Metal Artifact Reduction
Metal Artifacts in CT Images
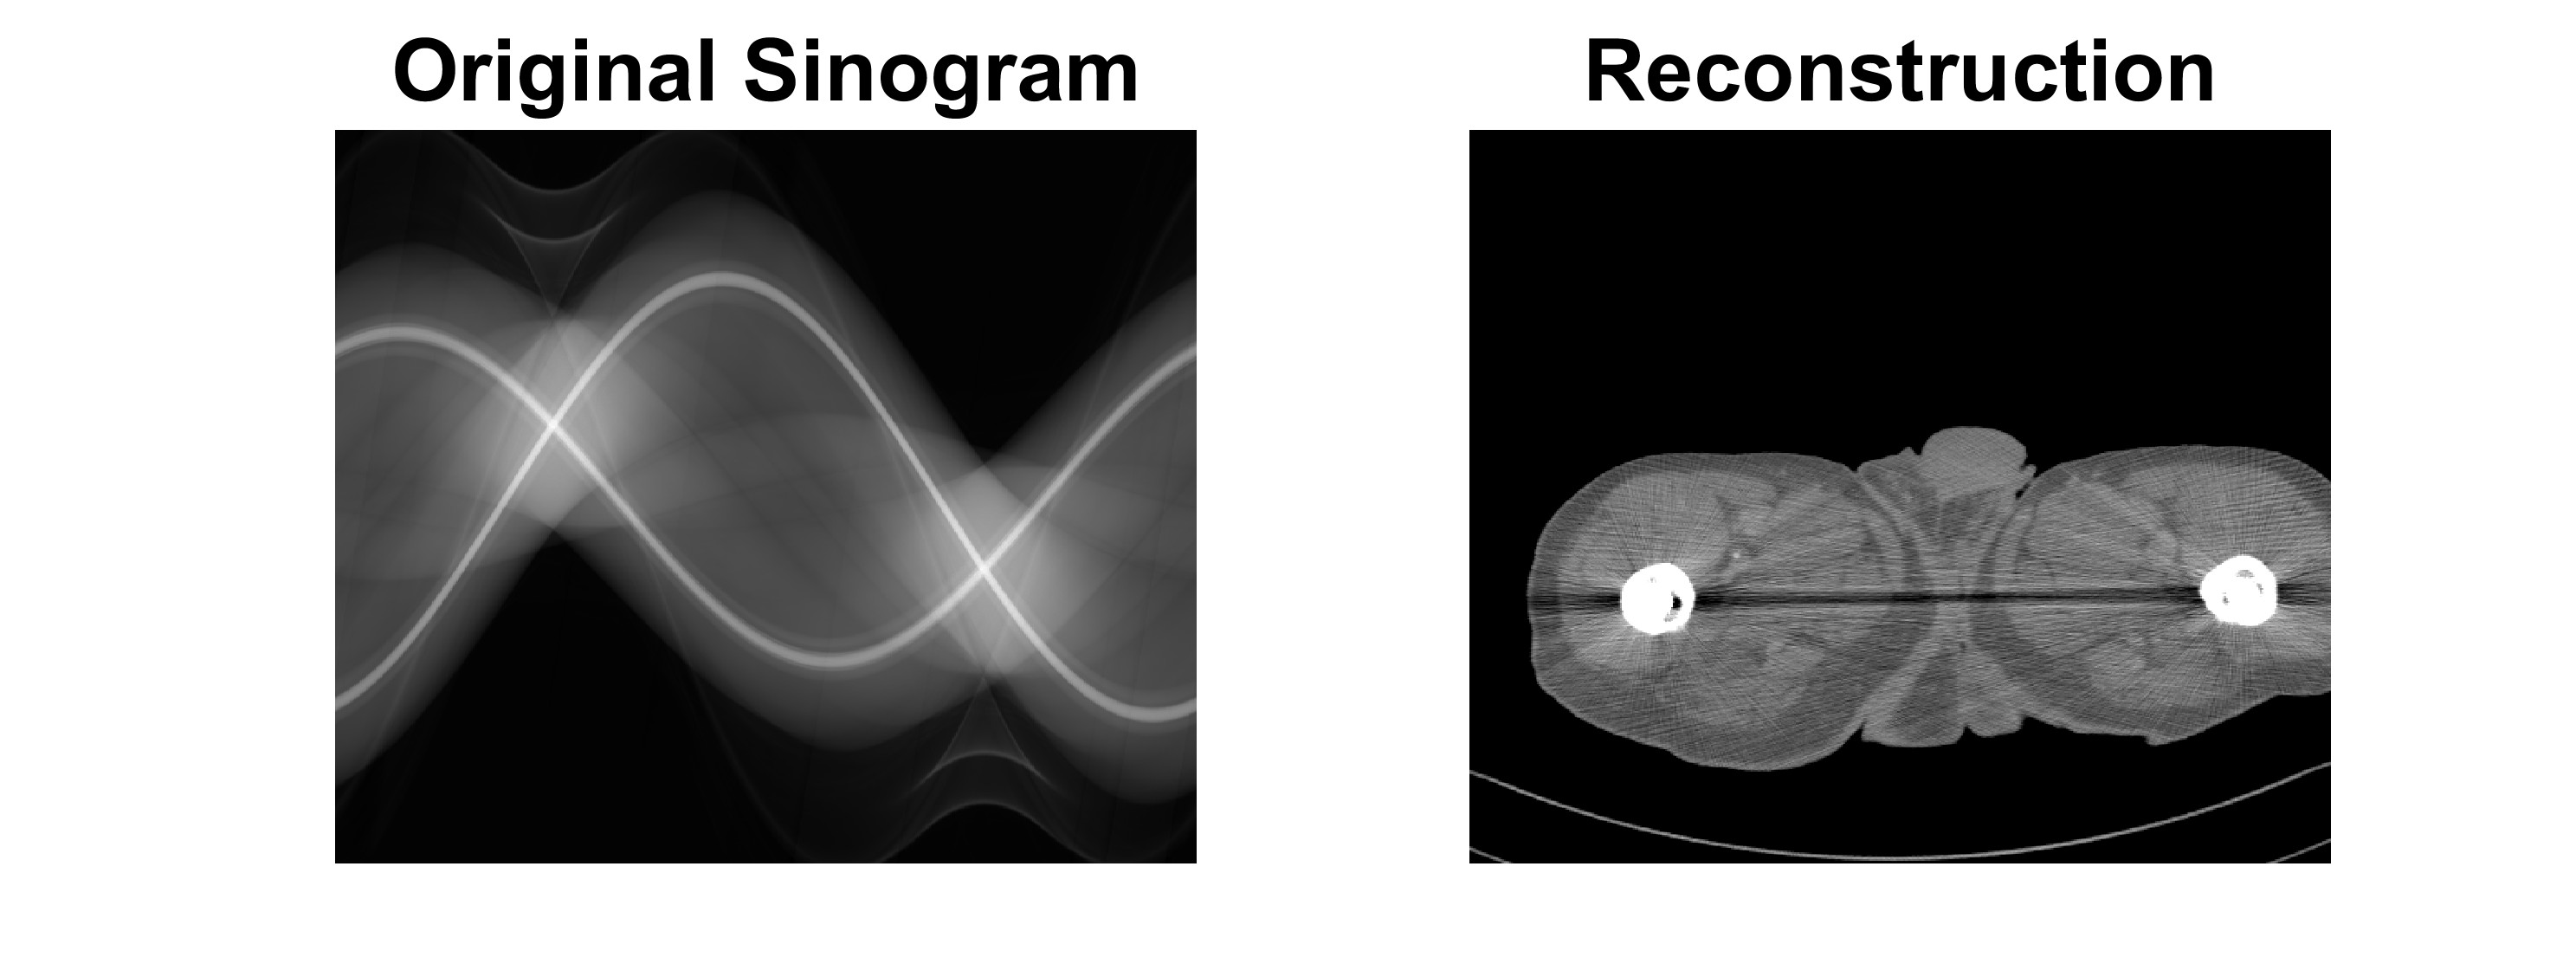
Metal in CT scans cause problems for how they affect the x-rays. The noise is pictured in this image.
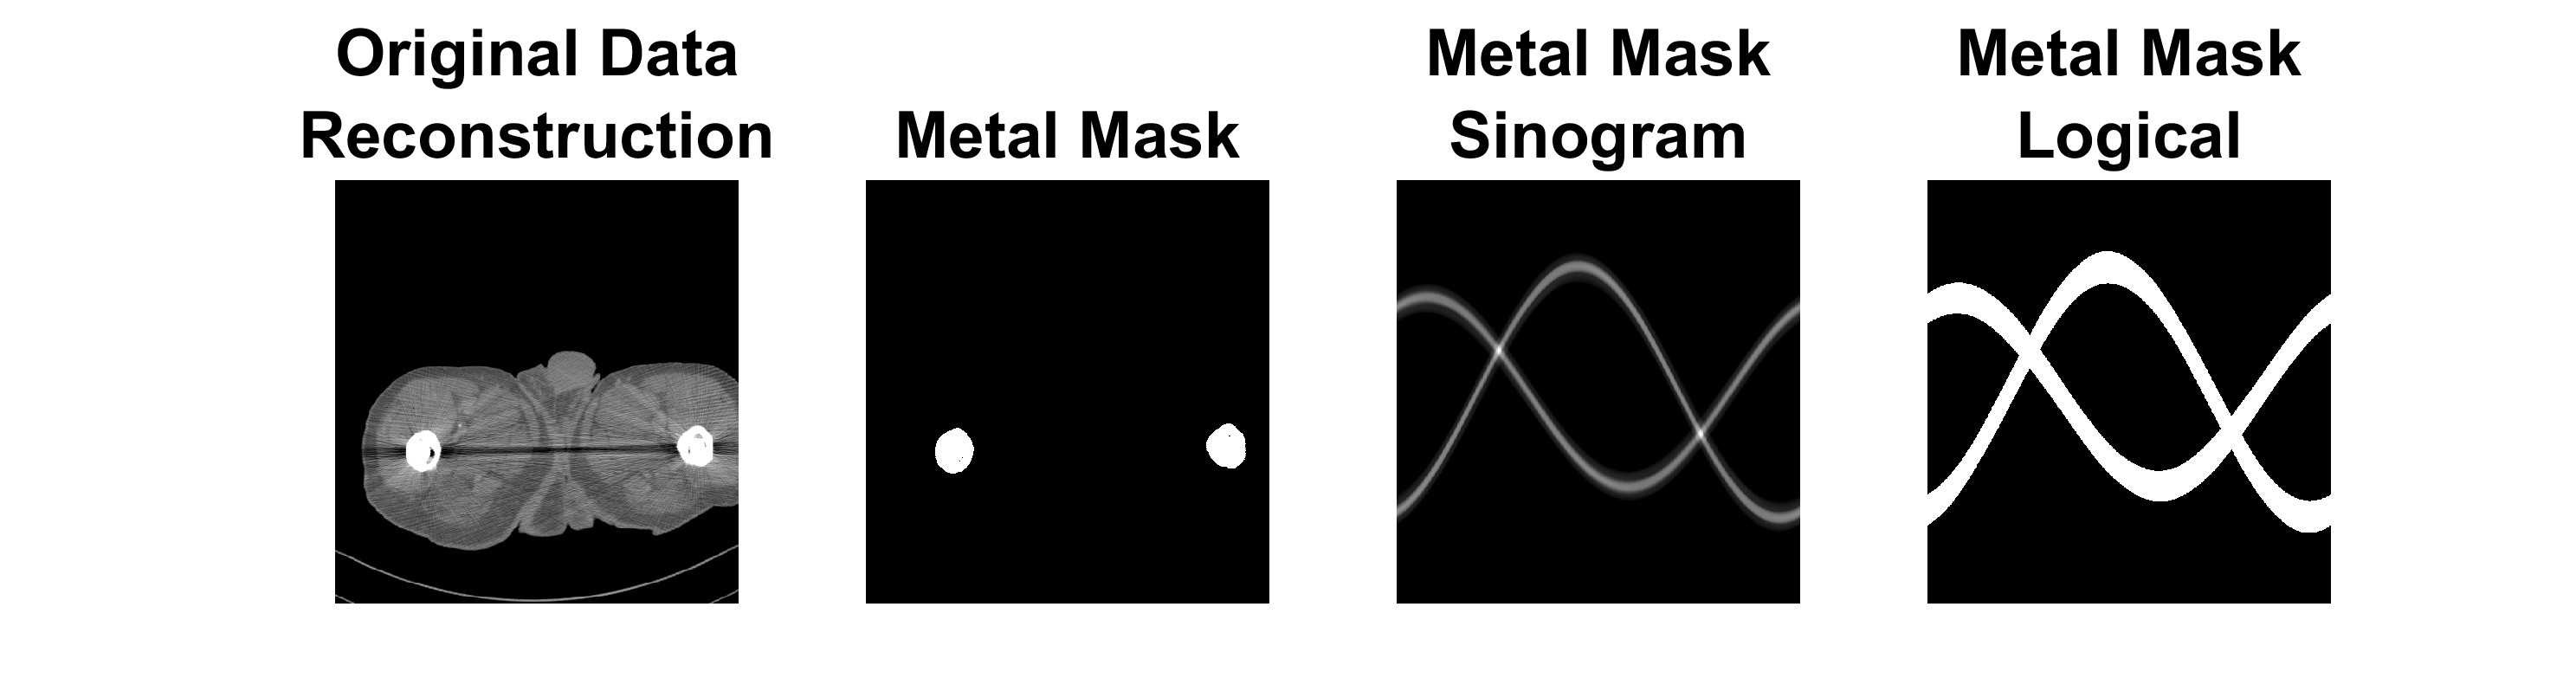
Creation of Metal Mask
Masks are commonly used in imaging to identify areas of interest. In this case, the metal is a structure of high attenuation. So the idea is to isolate these regions, transform it into sinogram space, and then apply this mask to the sinogram and reconstruct.
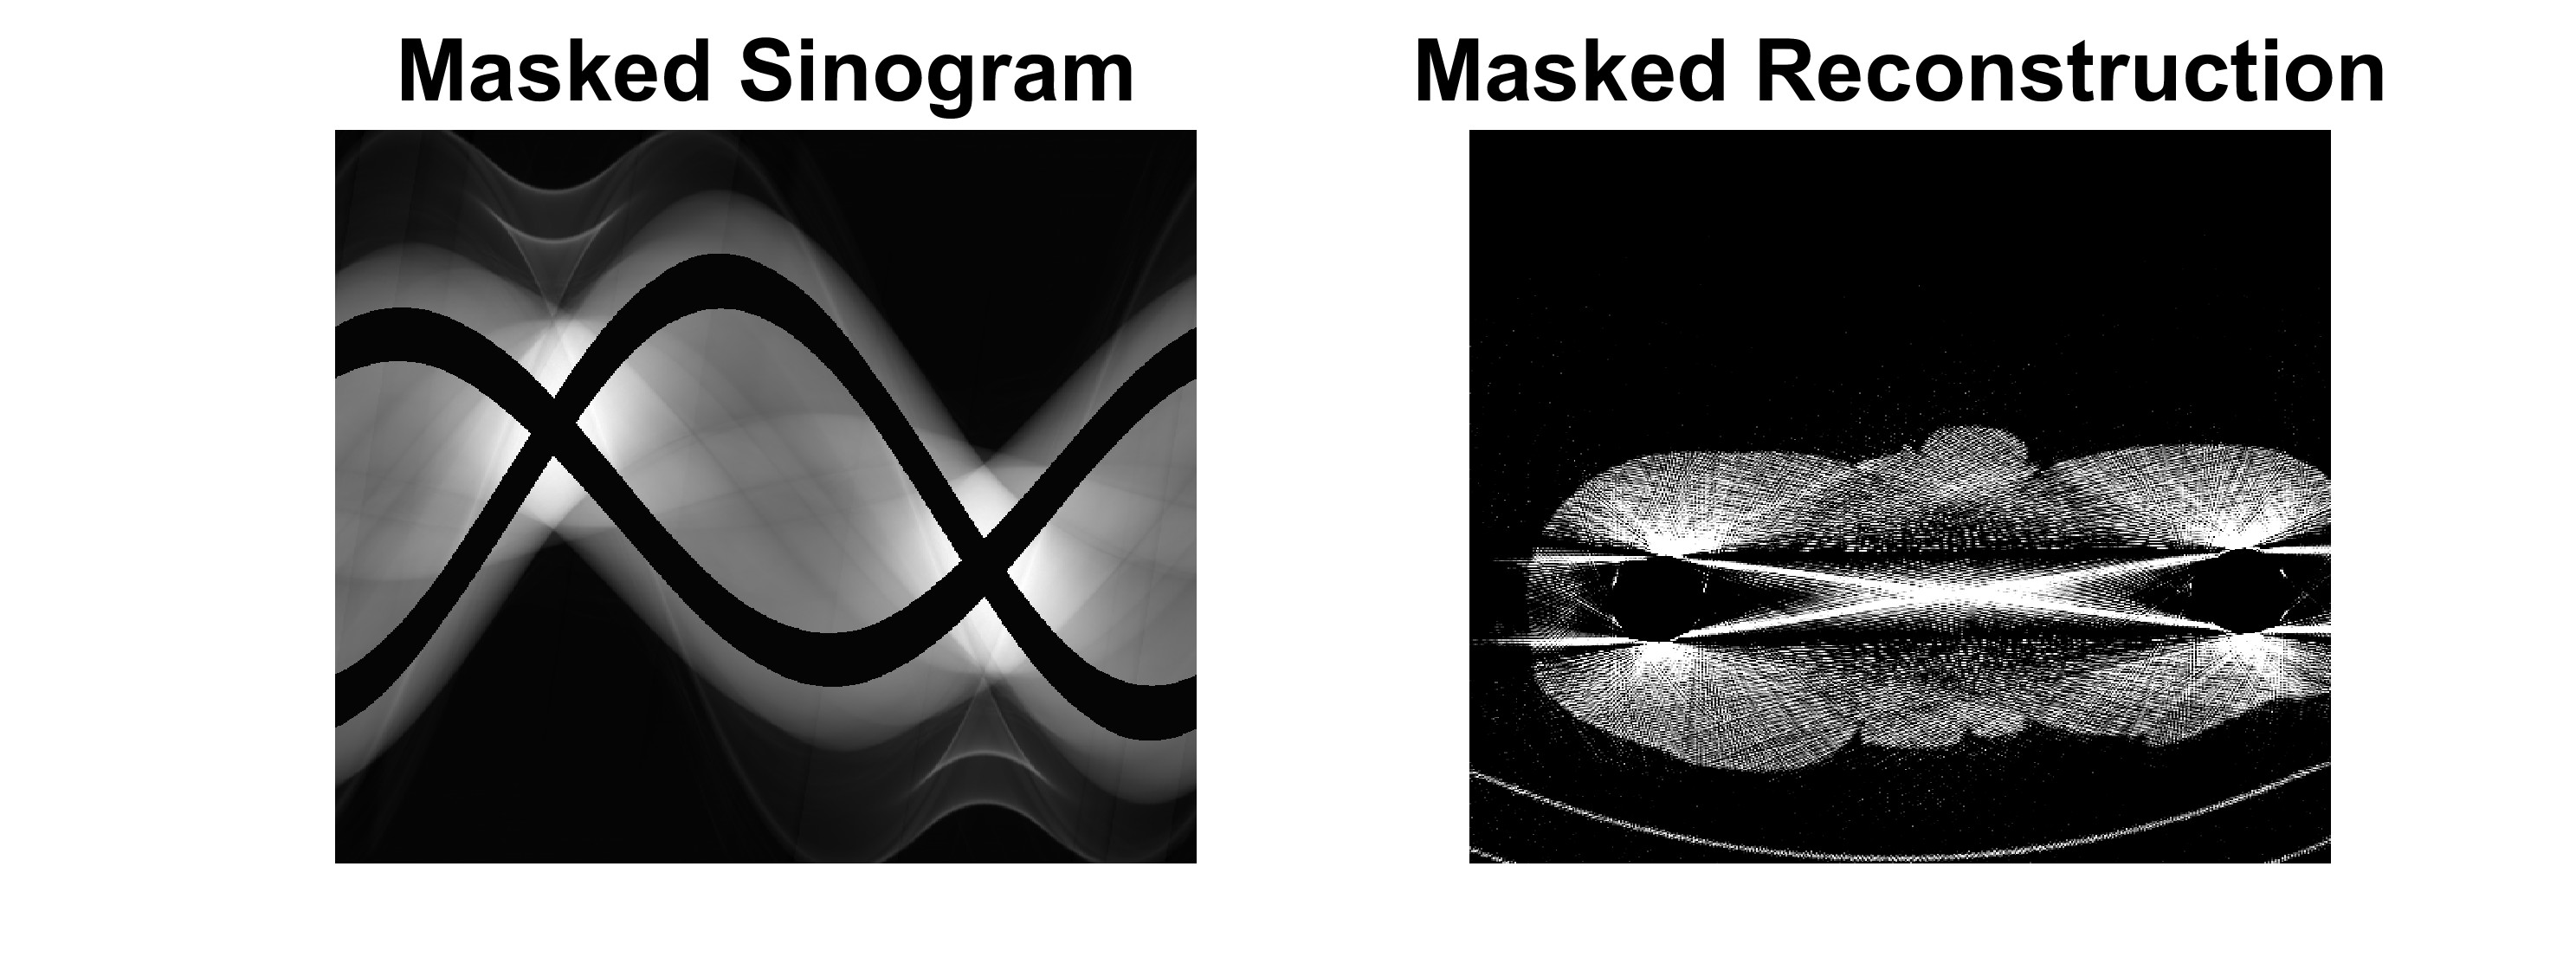
Results of Removing Metalic Regions
The results of the masked sinogram and masked reconstruction is pictured here. The metal data is gone, but so is much of the other relevant data. So more must be done.
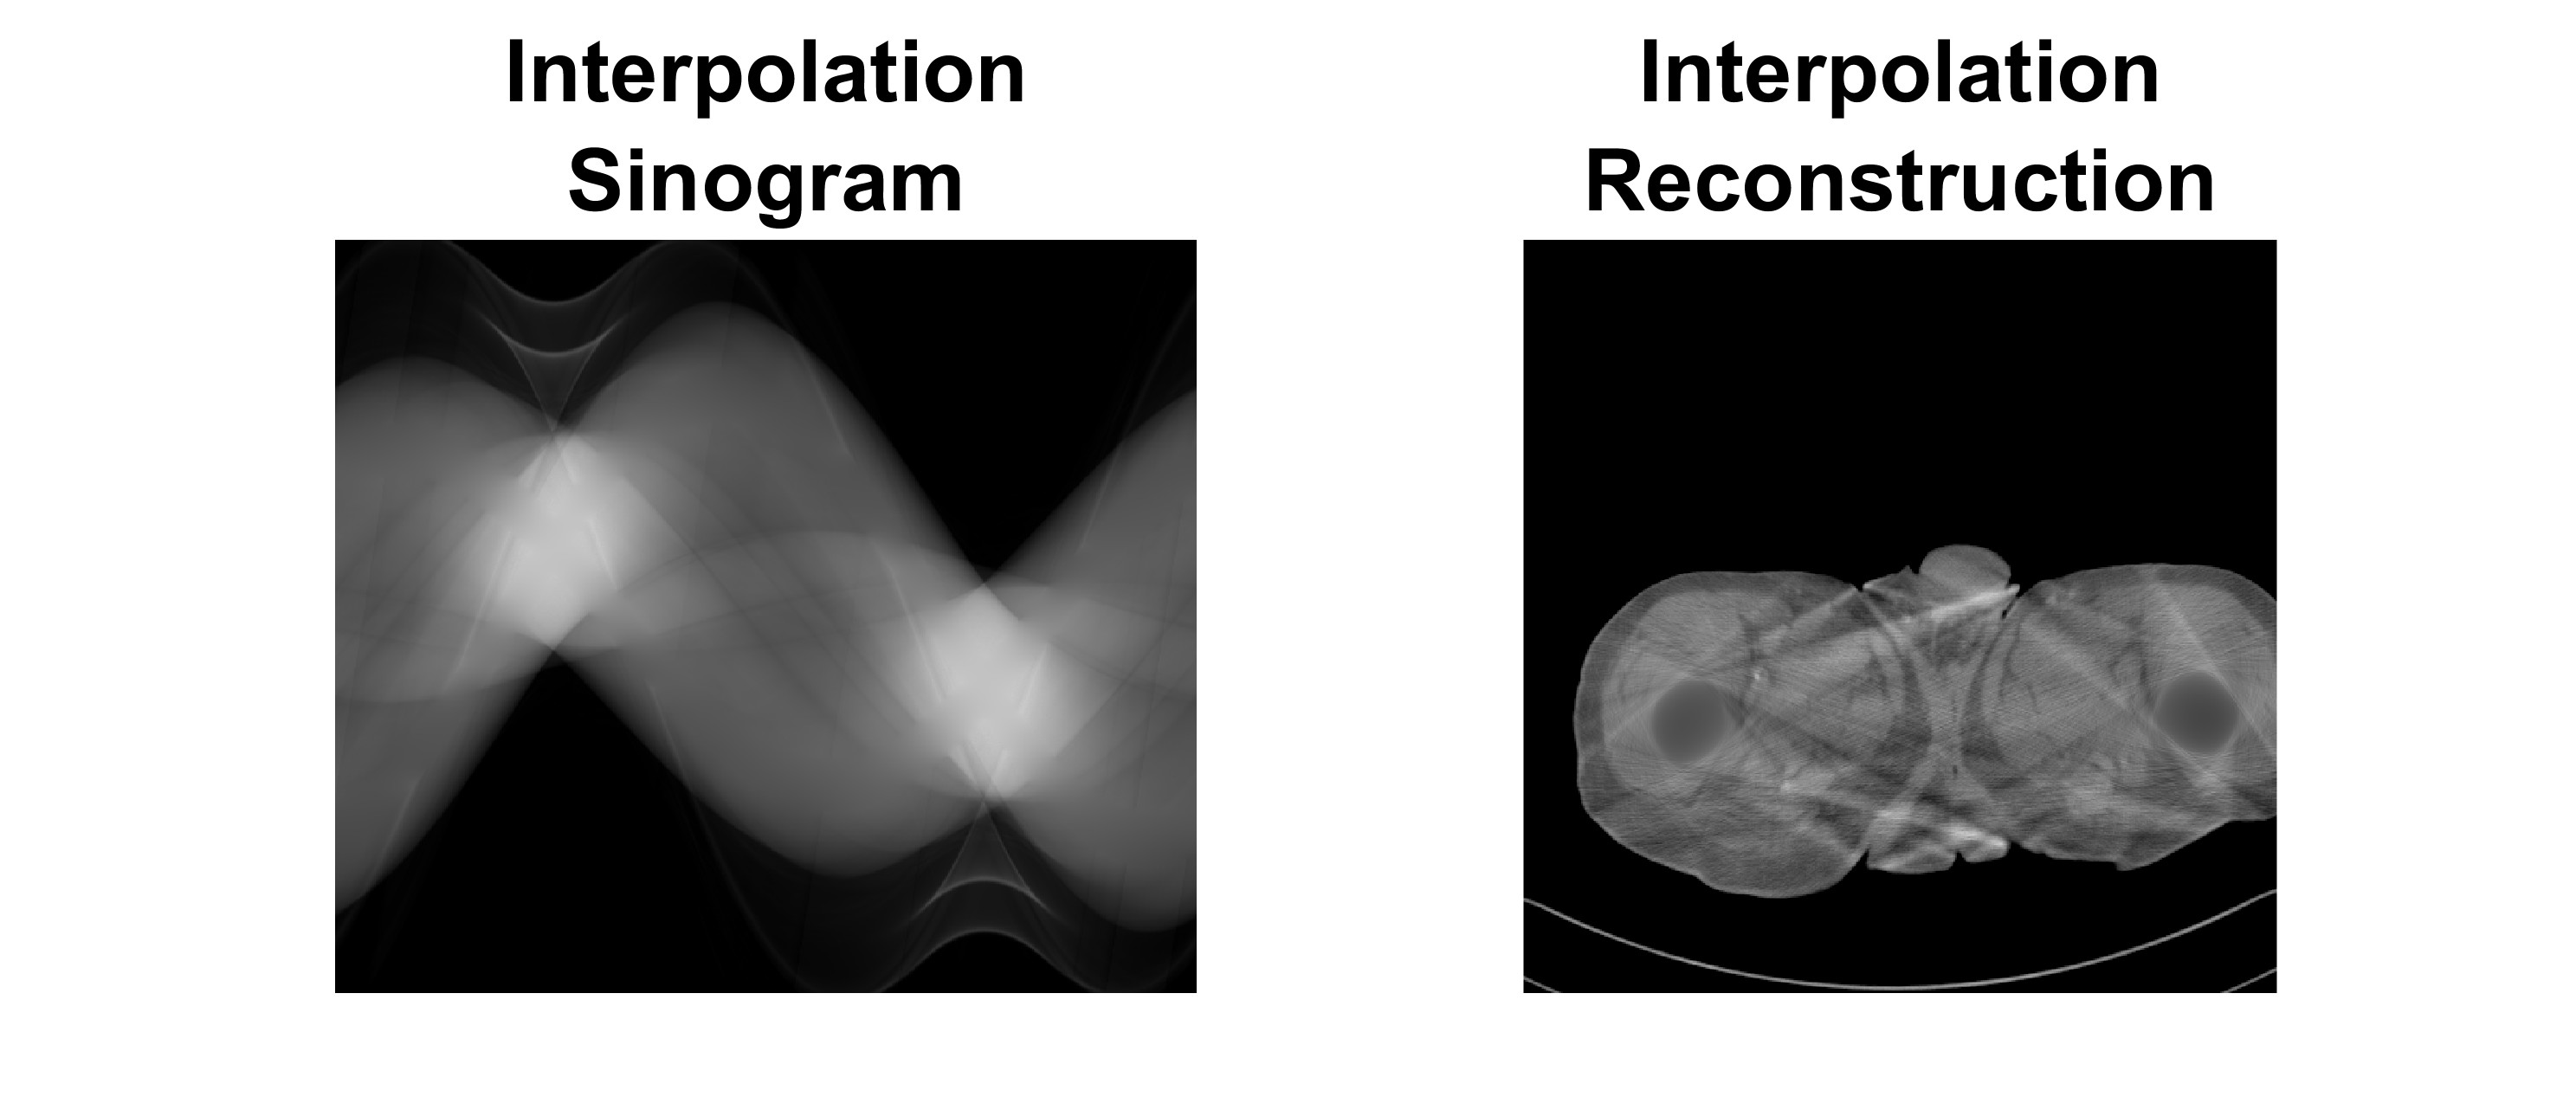
Interpolation of Missing Information
A simple interpolation algorithm is performed on the sinogram data using the mask called regionfill(). This is an internal function within MATLAB and worked very well to showcase how this method works. There was another method shown in this git repo.